This is the final piece of the 3 part series "The path to your first SLO". We have discussed on the basics of what to observe and how to get the relevant metrics in part 1 and part 2 of this series. This time we are going to have a quick look on to setup a simple service availability monitoring SLO with Nobl9and SolarWinds Pingdom.
Series Overview: The Path to Your First SLO
This comprehensive 3-part series guides you through building an effective observability practice, from identifying the right metrics to implementing your first Service Level Objective.
Prerequisites
Before setting up your first SLO, ensure you have:
- Identified your golden metrics (from Part 1)
- Established data collection methods (from Part 2)
- Access to Nobl9 platform
- SolarWinds Pingdom account for monitoring
SLO Setup Process
Step 1: Define Service Availability
Start by defining what "availability" means for your service. This typically includes:
- HTTP response codes (200-299 range)
- Response time thresholds
- Error rate limits
Step 2: Configure Nobl9
Set up your SLO in Nobl9 with the following configuration:
Step 3: Integrate SolarWinds Pingdom
Connect Pingdom as your data source for monitoring:
- Configure Pingdom checks for your endpoints
- Set up appropriate check intervals
- Configure alerting thresholds
- Export metrics to Nobl9
Best Practices
Do's
- • Start with simple, measurable metrics
- • Set realistic objectives (99.9% vs 100%)
- • Monitor SLO burn rate regularly
- • Document your SLO decisions
- • Review and adjust objectives quarterly
Don'ts
- • Don't set unrealistic objectives
- • Avoid too many SLOs initially
- • Don't ignore SLO violations
- • Avoid setting SLOs without stakeholder buy-in
- • Don't forget to monitor error budgets
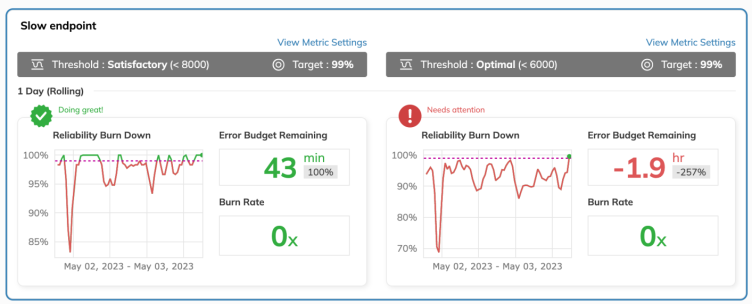
Monitoring and Alerting
Once your SLO is set up, it's crucial to monitor its performance and set up appropriate alerting:
Alerting Strategy
- Warning Level: 80% of error budget consumed
- Critical Level: 95% of error budget consumed
- Emergency Level: Error budget exhausted
Next Steps
Congratulations! You've successfully set up your first SLO. This is just the beginning of your observability journey. Consider these next steps:
- • Expand SLO coverage to more services
- • Implement SLIs (Service Level Indicators)
- • Set up automated remediation
- • Create SLO dashboards for stakeholders
- • Establish SLO review processes
About Vsceptre
Vsceptre specializes in observability solutions and DevOps best practices. Our team of experts helps organizations implement robust monitoring, feature management, and application reliability solutions to minimize downtime and enhance user experience.
For further information, contact Vsceptre at charliemok@vsceptre.com