How to obtain the metrics for SLO tracking
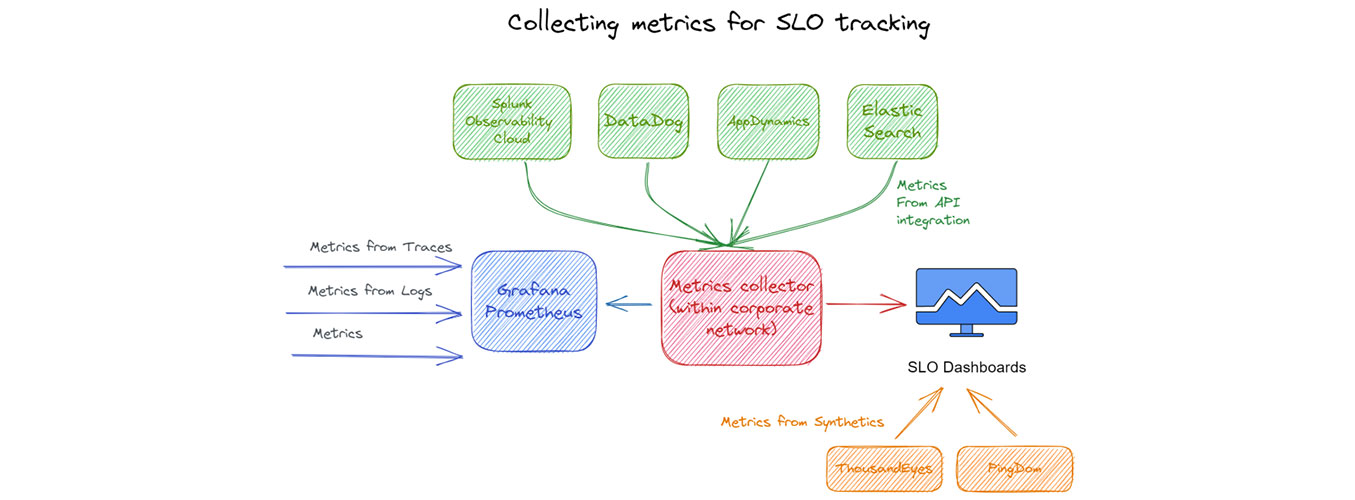
This is part 2 of the 3 part series "The path to your first SLO". When you have a clear understanding of what metrics to gather for SLO, the next question is how to obtain and gather those metrics. Basically the metrics can be obtained by the following methods.
Series Overview: The Path to Your First SLO
This comprehensive 3-part series guides you through building an effective observability practice, from identifying the right metrics to implementing your first Service Level Objective.
Metrics Collection Methods
Application Metrics
Direct instrumentation within your application code to capture business and technical metrics.
- • Response times
- • Error rates
- • Throughput
- • Custom business metrics
Infrastructure Metrics
System-level metrics from servers, containers, and cloud resources.
- • CPU utilization
- • Memory usage
- • Disk I/O
- • Network traffic
Synthetic Monitoring
Automated tests that simulate user interactions to monitor service availability.
- • Uptime monitoring
- • Response time checks
- • Transaction monitoring
- • API endpoint testing
Data Collection Pipeline
A typical metrics collection pipeline involves several stages:
Instrumentation
Add monitoring code to your applications
Collection
Gather metrics from various sources
Aggregation
Process and aggregate raw metrics
Storage
Store time-series data for analysis
Visualization
Create dashboards and alerts
Best Practices
Do's
- • Start with high-impact metrics
- • Use consistent naming conventions
- • Implement proper sampling
- • Monitor collection system health
- • Document metric definitions
- • Set up data retention policies
Don'ts
- • Don't collect everything
- • Avoid high-cardinality metrics
- • Don't ignore data quality
- • Avoid vendor lock-in
- • Don't forget about costs
- • Avoid collecting PII data
Common Challenges
Data Volume
High-frequency metrics can generate massive amounts of data. Implement proper sampling and aggregation strategies to manage storage costs and query performance.
Metric Cardinality
Avoid creating metrics with high cardinality (many unique label combinations) as they can cause performance issues and increase costs.
Data Quality
Ensure data accuracy and consistency across different collection methods. Implement validation and monitoring for your metrics pipeline.
Next Steps
Now that you understand how to collect metrics, the next step is to set up your first SLO using these metrics. In Part 3, we'll walk through the practical implementation.
About Vsceptre
Vsceptre specializes in observability solutions and DevOps best practices. Our team of experts helps organizations implement robust monitoring, feature management, and application reliability solutions to minimize downtime and enhance user experience.
For further information, contact Vsceptre at charliemok@vsceptre.com