How to identify the golden metrics for SRE
This is part 1 of the 3 part series "The path to your first SLO". When talking about building an observability practice, many customers we talked to struggled on what to observe and usually frustrated with the alarm storms or false alarms. ITOps are concerned about centralized monitoring and gather metrics from different systems for proactive monitoring. App Owners are interested in the ability for fast root cause analysis and end-to-end tracing capabilities.
Series Overview: The Path to Your First SLO
This comprehensive 3-part series guides you through building an effective observability practice, from identifying the right metrics to implementing your first Service Level Objective.
The Four Golden Signals
Google's Site Reliability Engineering team identified four key metrics that provide a comprehensive view of system health and user experience:
Latency
The time it takes to serve a request. Focus on successful requests to avoid mixing in failed requests that might have very low latency.
Key Measurements:
- • 50th percentile (median)
- • 95th percentile
- • 99th percentile
Traffic
A measure of how much demand is being placed on your system. This can be requests per second, transactions per second, or concurrent users.
Key Measurements:
- • Requests per second
- • Concurrent users
- • Data transfer rate
Errors
The rate of requests that fail, either explicitly (HTTP 500s) or implicitly (requests that are too slow or return wrong content).
Key Measurements:
- • Error rate percentage
- • Failed requests per second
- • Error types breakdown
Saturation
How "full" your service is. A measure of your system fraction, emphasizing the resources that are most constrained.
Key Measurements:
- • CPU utilization
- • Memory usage
- • Queue depth
Understanding Business Context
While the four golden signals provide a solid foundation, it's crucial to understand what matters most to your specific business and users:
Key Questions to Ask
- • What does "good" look like for your users?
- • What are the critical user journeys?
- • What are the business-critical functions?
- • What are the cost implications of downtime?
- • What are the regulatory or compliance requirements?
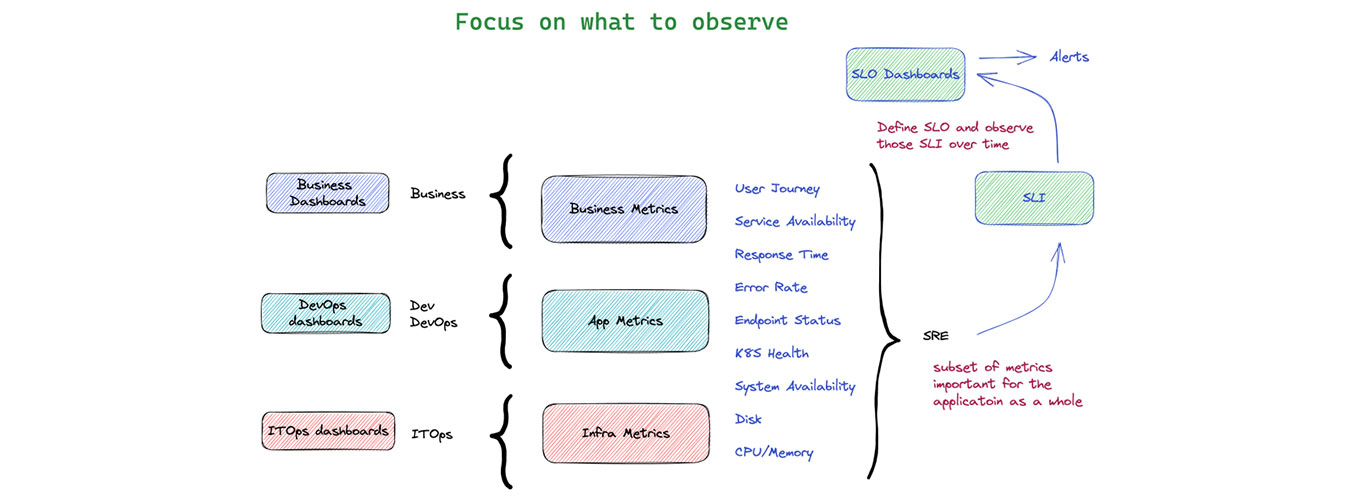
Different Stakeholder Needs
ITOps Perspective
Focus on centralized monitoring and gathering metrics from different systems for proactive monitoring and alerting.
- • Infrastructure health metrics
- • System resource utilization
- • Network performance indicators
- • Alert fatigue prevention
App Owners Perspective
Interested in fast root cause analysis and end-to-end tracing capabilities for application performance.
- • Application performance metrics
- • User experience indicators
- • Business transaction monitoring
- • Error tracking and debugging
Business Stakeholders
Need visibility into how technical metrics impact business outcomes and user satisfaction.
- • User satisfaction scores
- • Business impact metrics
- • Revenue impact indicators
- • Customer retention metrics
Implementation Strategy
Start with the Basics
Begin with the four golden signals before adding custom metrics
Focus on User Impact
Prioritize metrics that directly affect user experience
Avoid Alarm Fatigue
Set meaningful thresholds and avoid over-alerting
Iterate and Improve
Regularly review and refine your metrics based on learnings
Common Pitfalls to Avoid
What to Avoid
- • Measuring everything without focus
- • Ignoring business context
- • Setting unrealistic thresholds
- • Not involving stakeholders
- • Focusing only on technical metrics
- • Forgetting about data quality
Best Practices
- • Start simple and expand gradually
- • Align metrics with business goals
- • Set achievable targets
- • Involve all stakeholders
- • Balance technical and business metrics
- • Ensure data accuracy and consistency
Next Steps
Now that you understand the golden metrics, the next step is to learn how to collect and gather these metrics effectively. In Part 2, we'll explore different methods for obtaining the data you need.
About Vsceptre
Vsceptre specializes in observability solutions and DevOps best practices. Our team of experts helps organizations implement robust monitoring, feature management, and application reliability solutions to minimize downtime and enhance user experience.
For further information, contact Vsceptre at charliemok@vsceptre.com