Demystifying Log to Trace correlation in DataDog
If you have a chance to attend any presentation or public seminars from the APM vendors, you may come across some demonstrations of how easily to jump from trace to log or log to trace to diagnose a slow API call. This is one of the key differentiation of using a siloed approach for monitoring vs true full stack visibility.

DataDog's comprehensive APM and observability platform for full-stack visibility
Table of Contents
Introduction
If you have a chance to attend any presentation or public seminars from the APM vendors, you may come across some demonstrations of how easily to jump from trace to log or log to trace to diagnose a slow API call. This is one of the key differentiation of using a siloed approach for monitoring vs true full stack visibility. Often times, the technical details and prerequisites of how to achieve this are omitted from those overview demos. Today I am going to take a more detail discussion of how to ensure your application can achieve the log to trace correlation. We use DataDog as the example monitoring backend in this exercise.
Install DataDog agent for auto instrumentation
The first step is to install DataDog agent. We use the host version and installed on Ubuntu. The latest agent installation script can be found on DataDog portal with API keys pre-populated. We also enabled the beta feature to instrument any application automatically running on the host. That covers .Net and Java framework. A single agent provides you with both infrastructure metrics and application tracing visibility and we leverage this for the exercise here.
DD_API_KEY=xxxxxxxxxxxxxxxx DD_SITE="datadoghq.com" DD_APM_INSTRUMENTATION_ENABLED=host bash -c "$(curl -L https://s3.amazonaws.com/dd-agent/scripts/install_script_agent7.sh)"The different approaches for Log to trace correlation
Next, we need to find a sample application. Instead of building your own I found this repo which provides a skeleton for the exercise. https://github.com/zachelrath/structured-logging-spring-boot. A requirement to support log to trace correlation without the need for code modification is to use a supported logging framework. For our example here we use a Java Spring Boot application with Log4j2. This will automatically provides you the foundation for trace to log correlation.
Once the application is instrumented with the java tracer, the traceID and SpanID will be inserted automatically in every logs generated. This is where the magic for the correlation happens. Under the hood, DataDog make use of the Environment Variable: DD_LOGS_INJECTION to enabled automatic MDC (Mapping Diagnostic Context) key injection for Datadog trace and span IDs. For those interested to learn more about how MDC works, you can reference this link https://www.baeldung.com/mdc-in-log4j-2-logback.
If you use a logging framework that doesn't come with auto correlation, you will need to inject the traceID into the log entries. Luckily, Spring Boot has built-in support for automatic request logging. The CommonsRequestLoggingFilter class can be used to log incoming requests. Adding a line similar to the example below to application.properties will provide the correlation information required.
logging.pattern.file=%d{yyyy-MM-dd HH:mm:ss} - %msg traceID=%X{trace_id} %nAutomatic tracing with DataDog agent
Back to our example of using Log4j2 as the logging framework, now compile the application according to the introduction of the repo. Start the application with the command.
sudo java -jar structured-logging-demo-0.0.1-SNAPSHOT.jar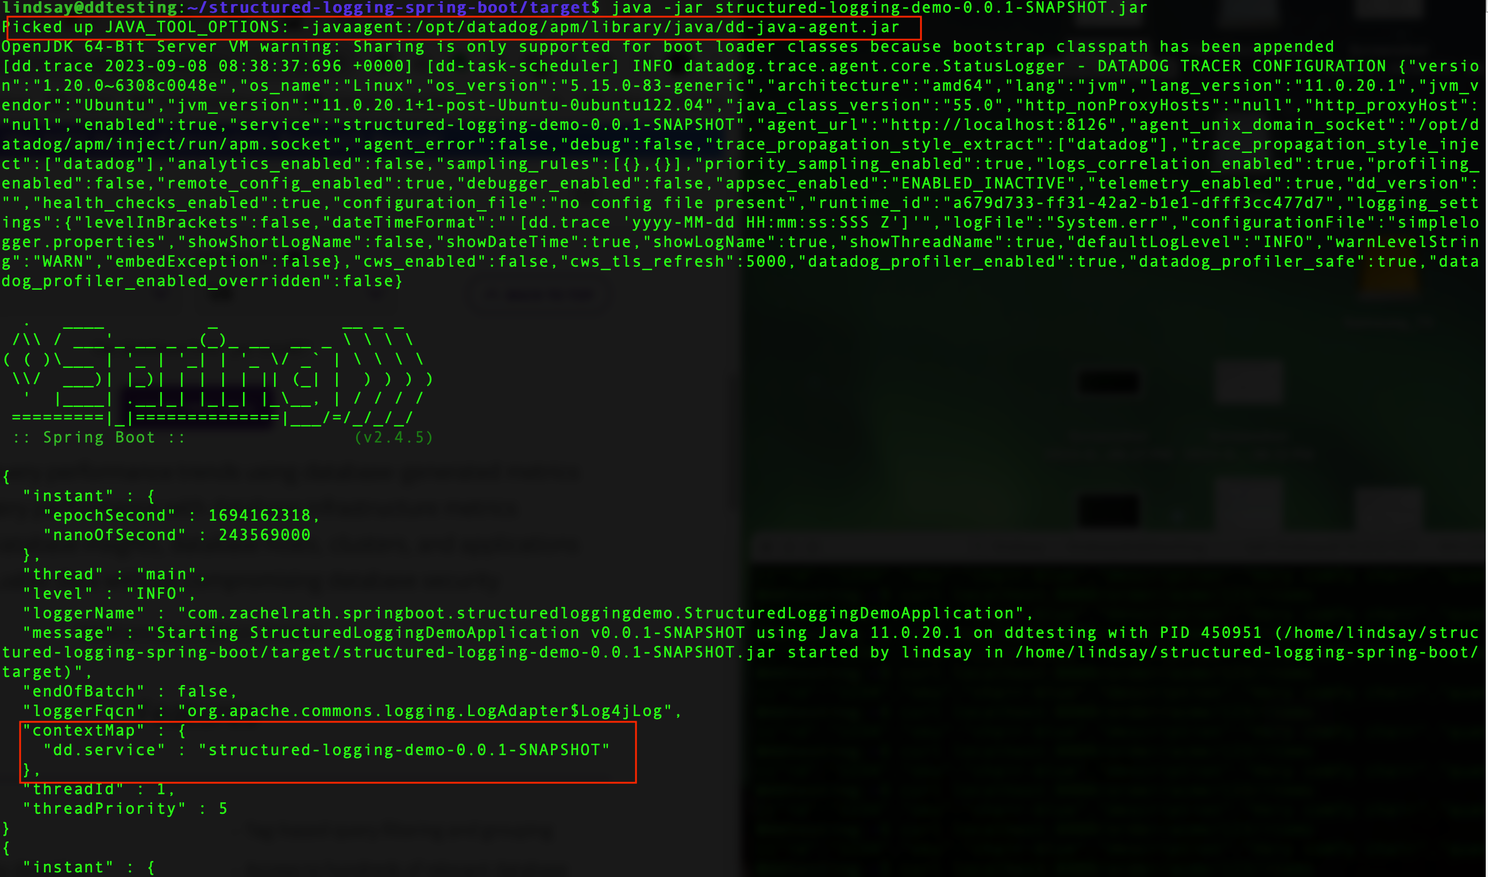
DataDog agent installation with auto-instrumentation enabled
First we noticed that the java application has been automatically detected and instrumented by DataDog agent. The Service tag has also populated with the application name using auto MDC injection into logs as shown.
Issue some requests with different item IDs and you will get the following response
curl localhost:8080/order/acme/123/items
[{"id":"1234","sku":"chair-blue","description":"Very comfy chair","quantity":null}]
From the java application console log you will find the span_id and trace_id being added to the log automatically for each request.
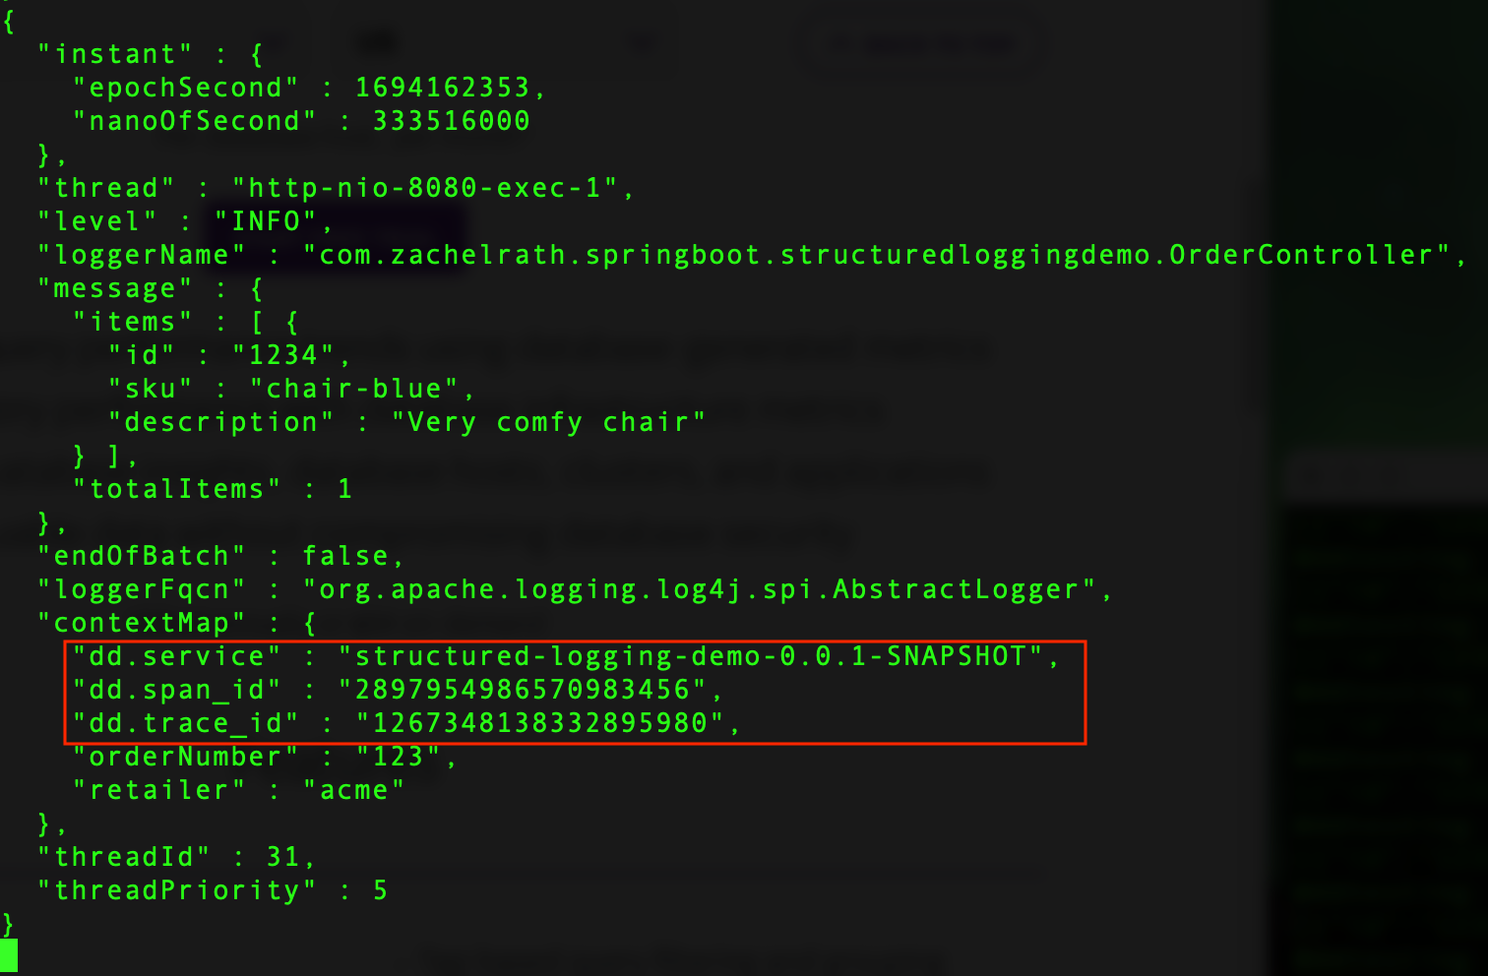
Java application startup with DataDog agent auto-instrumentation and MDC injection
If you check the DataDog backend from the trace explorer, you will find the traces but with no correlation with logs. That is because we have not setup log correlation yet.
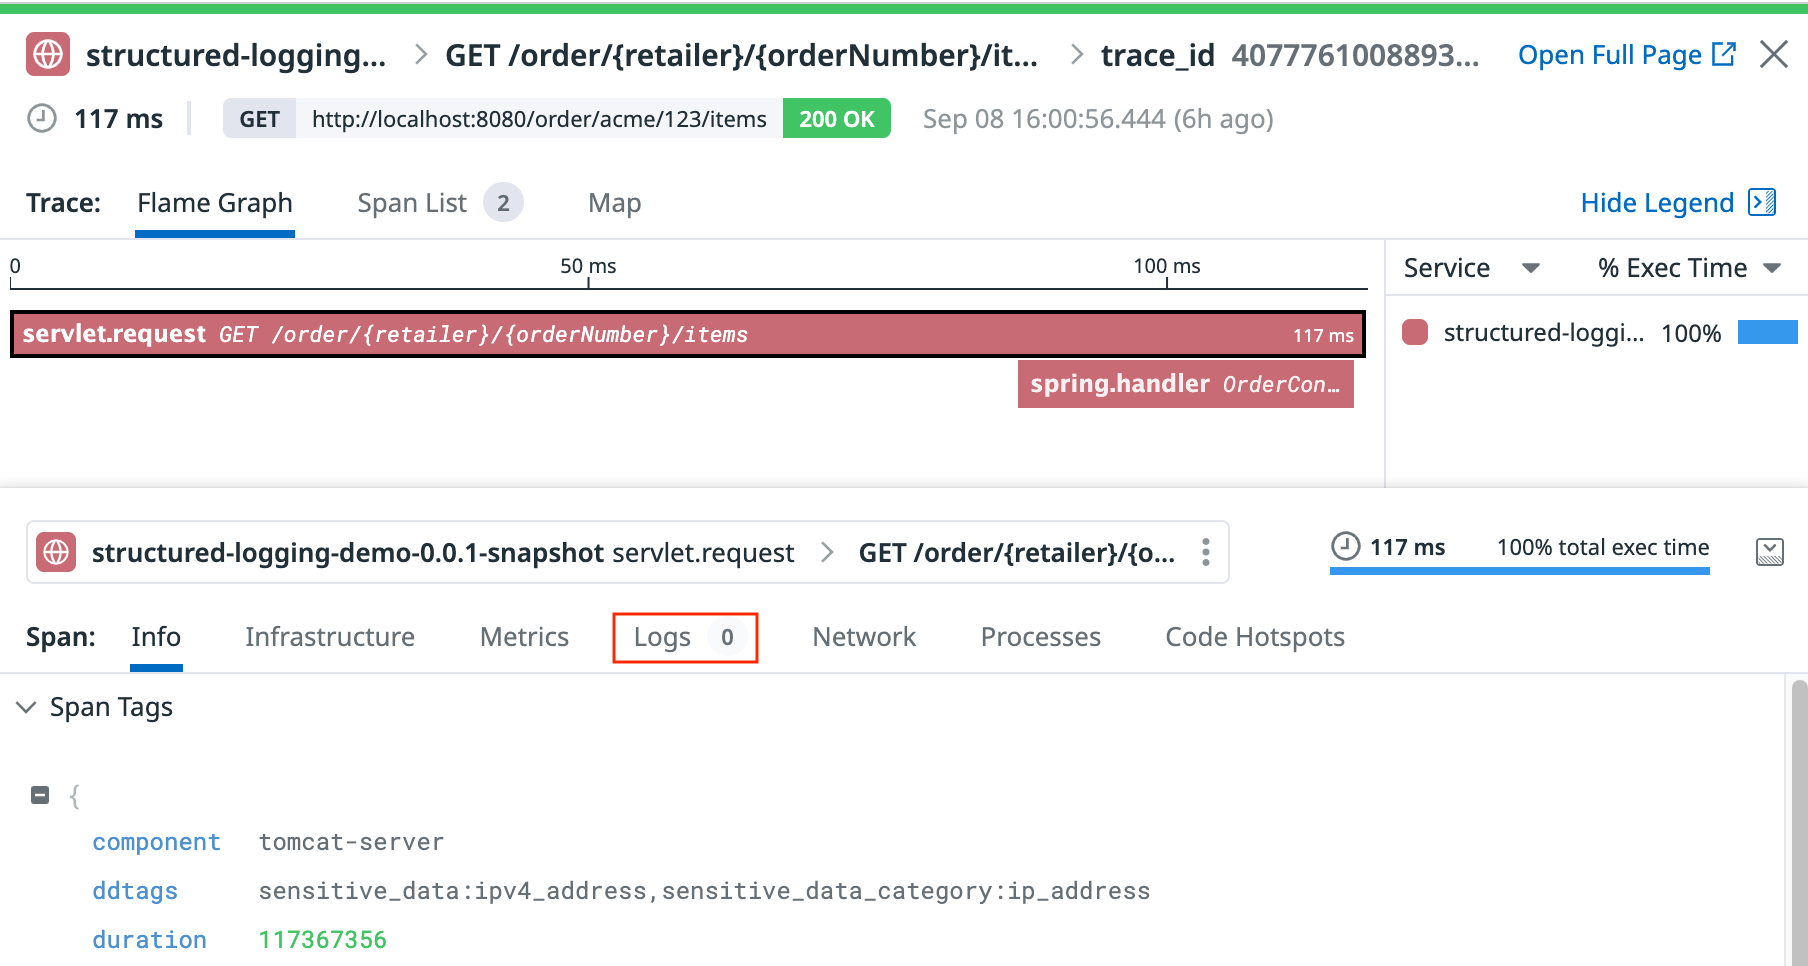
DataDog trace view showing successful log-to-trace correlation
Enable log file output in JSON format
Modern observability tools such as DataDog and ElasticsSearch expect injected log files to be in JSON format. However, our sample app output logs only to console in plain text format. We handle this by changing output formats to JSON and adding the support to log to a file. The modified log4j2.xml is as shown.
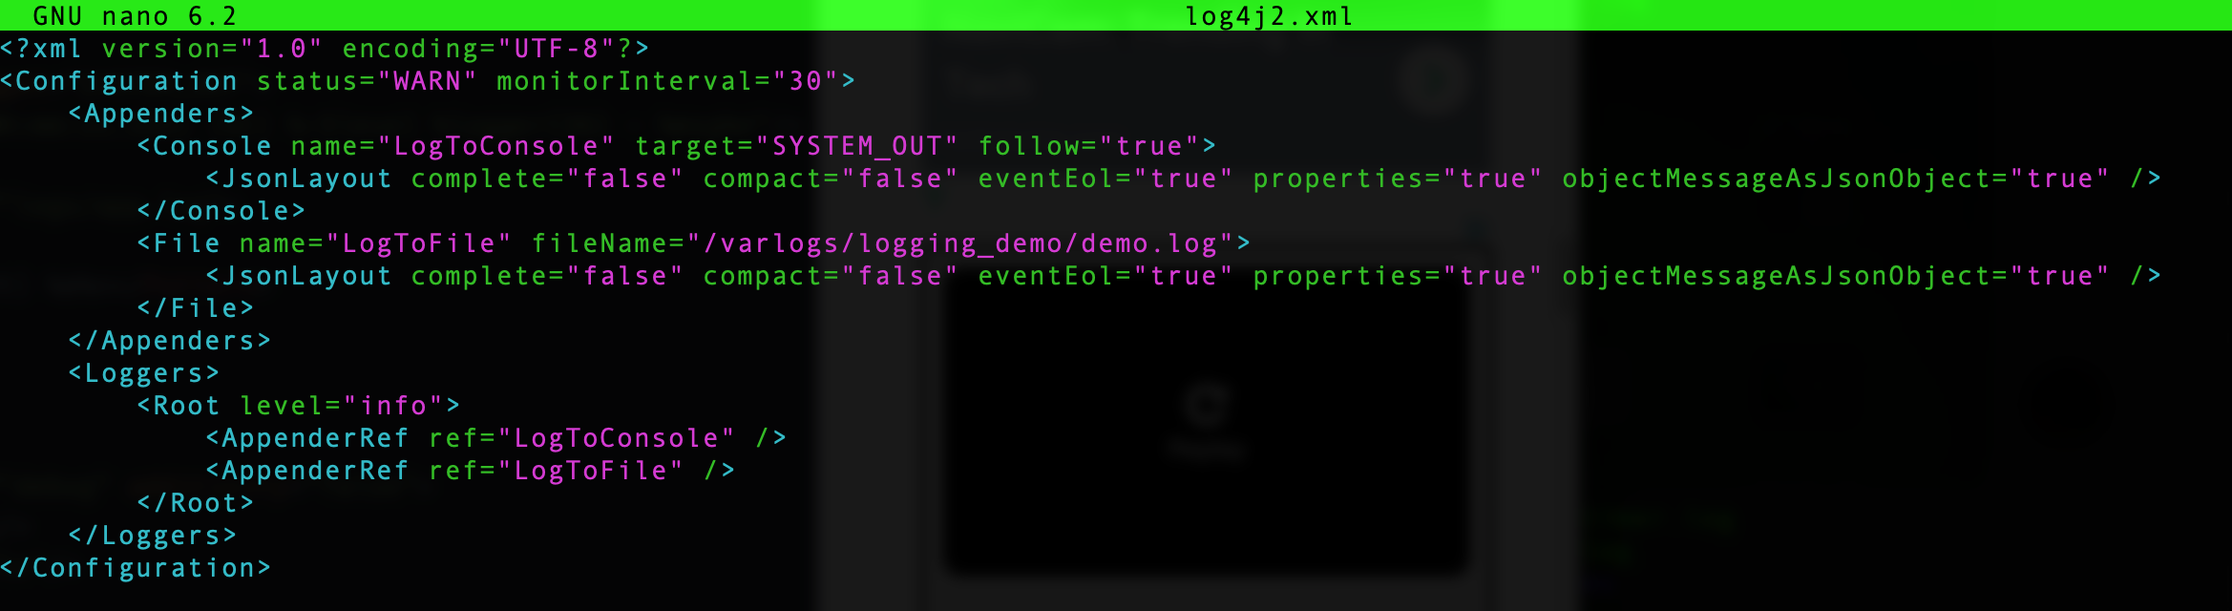
Log4j2 configuration file with JSON layout for console and file output
We have to recompile the sample application to pick up the new log configuration. If your application is already built with JSON format file output at the very beginning you don't need to care about this step.
Preparing the DataDog agent for log injection
Now the application is ready. The next step is to enable logging on DataDog agent from the /etc/datadog-agent/datadog.yaml file. Then go to setup a custom log collection to pickup the logs for our application. I created a directory under /etc/datadog-agent/conf.d/logging_demo.d and create a conf.yaml file with the following content.
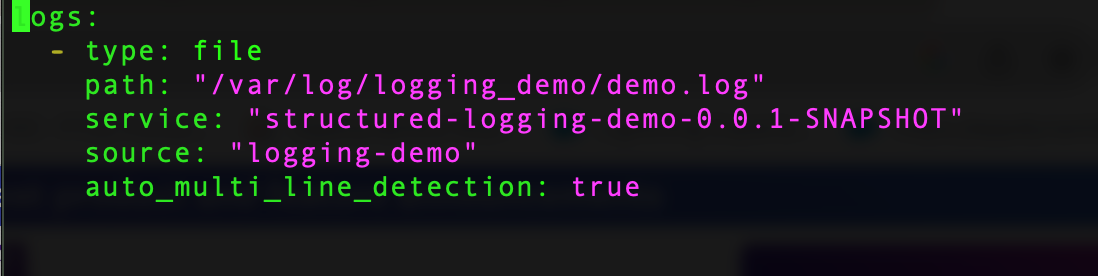
DataDog agent log collection configuration for custom application logs
Make sure the path is accessible for read access by DataDog agent. The service and source tag is needed for log correlation. You can reference the DataDog doc on the details. Also, the service name must be the same as the APM service name we described previous. Now DataDog agent will tail the file written to this path and send it to DataDog backend for the log entries. Details can refer to this doc. https://docs.datadoghq.com/agent/logs/?tab=tailfiles. For the last line of the above screenshot, we utilize is a new feature from DataDog to automatically parse multi-line json files. This setting can be omitted for JSON log formats.
Check log to trace correlation
Finally, go to DataDog console and check logs on our service, you will now see each log entry will be associated with the trace, allowing you to jump from log to trace and vice versa for troubleshooting.
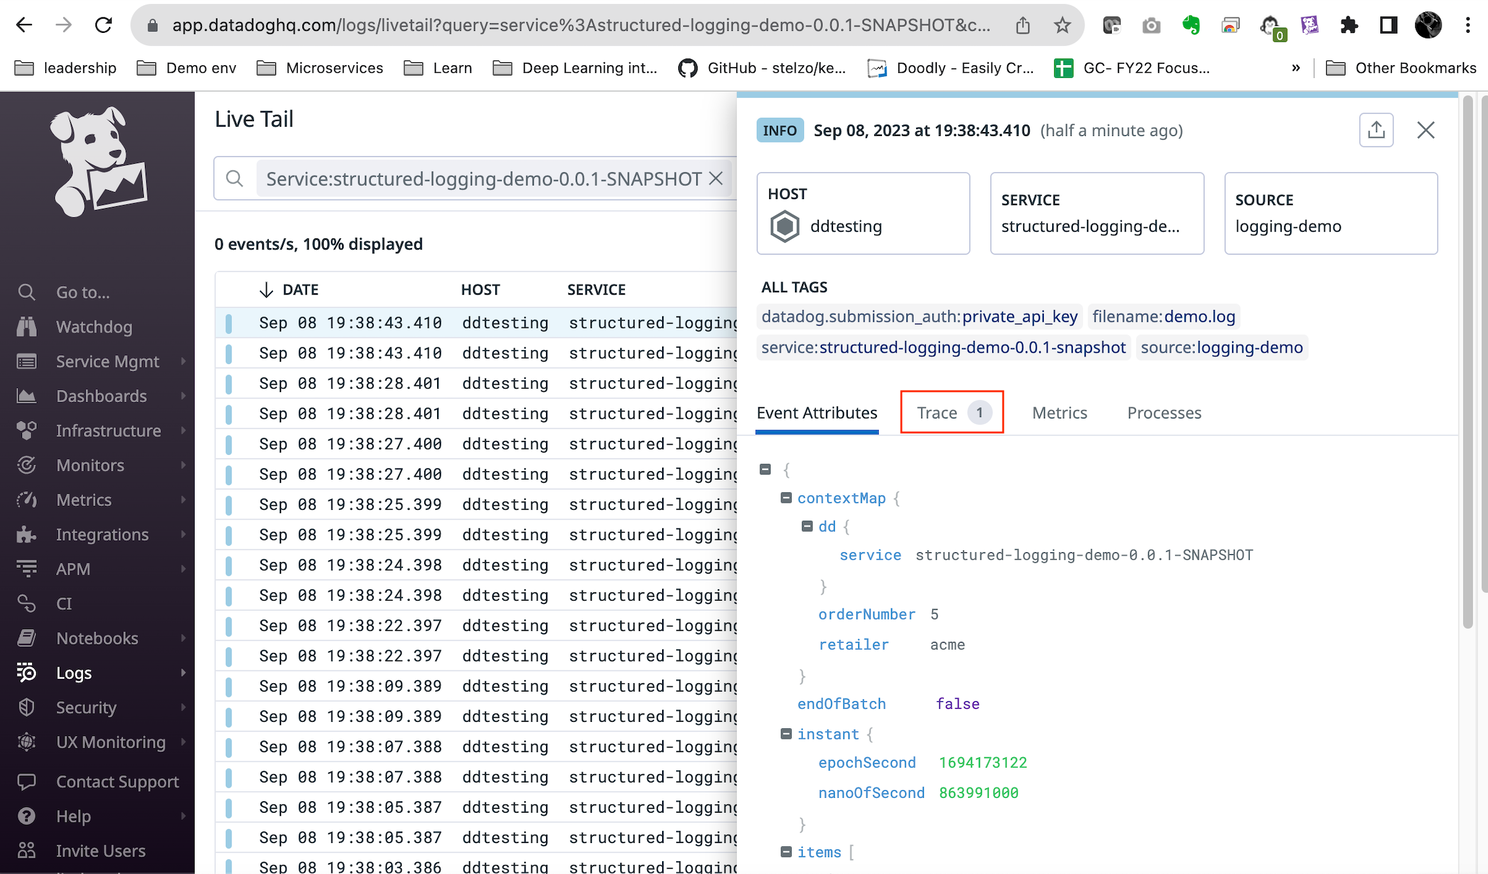
JSON log entry with automatic trace_id and span_id injection for correlation
PS. DataDog recommended to configure your application's tracer with DD_ENV, DD_SERVICE, and DD_VERSION. This will provide the best experience for adding env, service, and version. As of this writing, auto APM instrumentation is still a beta feature from DataDog. I haven't found a way to properly add the DD_ENV, DD_VERSION in a dynamic manner for a host agent implementation.
Summary
I hope this post is useful for you to understand how auto instrumentation works for DataDog and how to achieve log to trace correlation. Having a logging framework that supports automatic traceID and spanID integration will save you a lot work on manual instrumentation. The background knowledge described here can be applied to other APM implementations no matter whether you are using DataDog or OTEL to monitor your application.
About Vsceptre
At Vsceptre, we connect people with technology. Our team of DevOps and observability experts helps organizations implement comprehensive monitoring solutions and achieve full-stack visibility across their distributed systems.
Contact our specialist at charliemok@vsceptre.com to arrange a free one-on-one consultation session.
Related Articles
Log Sensitive Data Scrubbing and Scanning on Datadog
In today's digital landscape, data security and privacy have become paramount concerns for businesses and individuals alike.
ObservabilityMonitoring temperature of my DietPi Homelab cluster with Grafana Cloud
At around end of March, I want to get my hands on the old raspberry pi cluster again as I need a testbed for K8S, ChatOps, CI/CD etc.